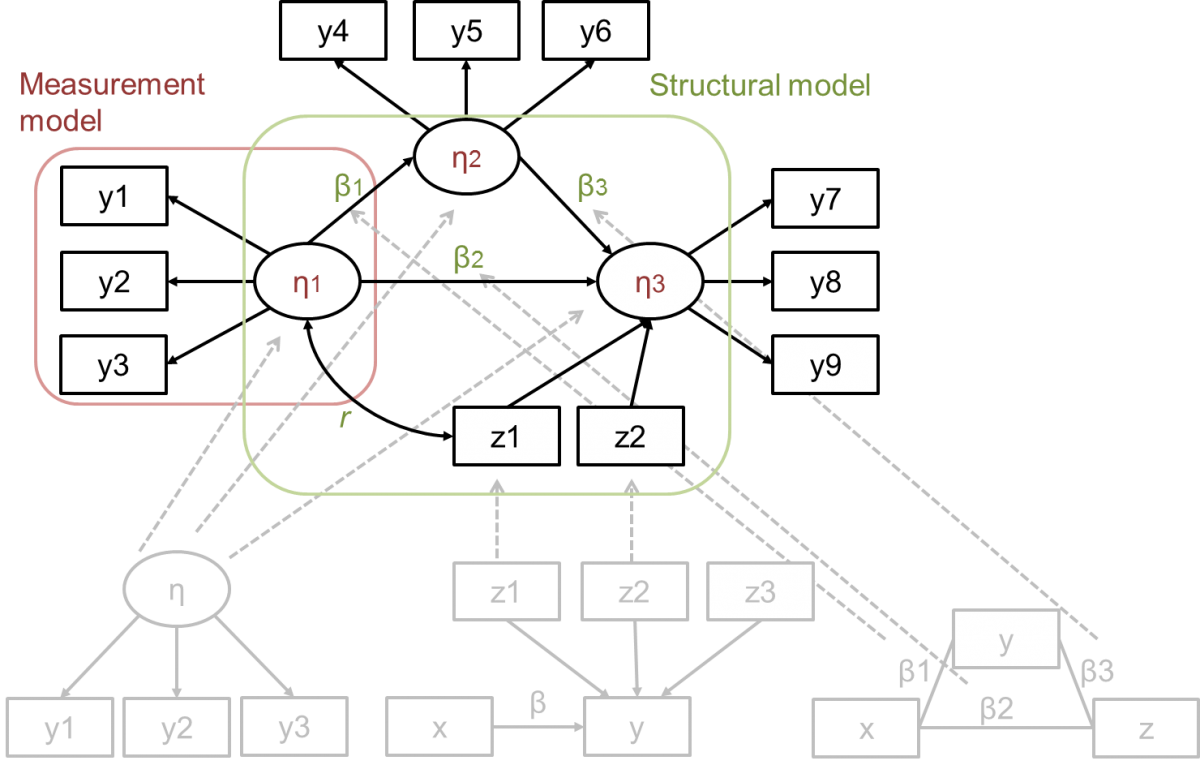
Advanced Structural Equation Modelling
This course is designed as an advanced course in Structural Equation Modeling (SEM) for existing AMOS and/or Mplus users.

Introduction to Social Network Research and Analysis
Designed for mixed methods and qualitative researchers, this course covers data collection and research design, visualisation and basic analytic methods used in social network research.

Seriously Applied Regression Analysis (3-day)
Multiple regression is a statistical workhorse of the social sciences. This three-day short course is designed for participants who want to strengthen their understanding of regression analysis and apply it confidently in academic research.

Introduction to Large Language Models (LLMs) in Social Sciences (3-day)
An introduction to Large Language Models (LLMs) in the context of social sciences, offering hands-on, practical experience - no coding expertise or advanced maths skills required.

Harnessing MAXQDA for Qualitative Analysis (2-day)
This 2-day master-class provides a comprehensive introduction to the use of MAXQDA for qualitative analysis, focusing on harnessing its tools appropriately within methodological contexts.

NVivo for a Literature Review (2-day)
This master-class introduces NVivo, and takes researchers through the process of sorting and organising literature and notes from readings in a systematic way.

Machine Learning for Data Science: Supervised Learning Techniques (3-day)
An introduction to supervised machine learning techniques for data science, providing an interactive step-by-step guide to running some of the standard statistical regression and classification machine learning models that every data scientist should know.

Qualitative Research and Analysis with NVivo: From Research Design to Reporting

Introduction to R (3-day)
This masterclass offers a step-by-step, interactive introduction to R and RStudio for participants with no experience with these software packages.

Applied Statistical Procedures
This 5-day intermediate course will help you choose from a range of statistical procedures to analyse your data. It aims to provide participants with an ability to understand, run and interpret these procedures.
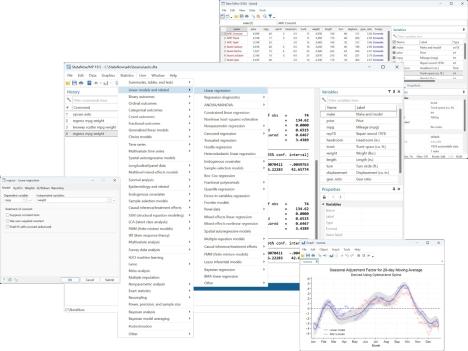
Data Analysis Using Stata
This 5-day course aims to provide you with the understanding and experience to undertake a basic research project in the social or health sciences using Stata as the statistical tool.

Introduction to Python for Social Sciences (2-day)
A step-by-step, interactive introduction to Python for participants with no experience with this software package.

Creating and Managing Web surveys using LimeSurvey (1-day)
How to set up, conduct and export your data for a web based survey in the freely available Limesurvey web survey software system.
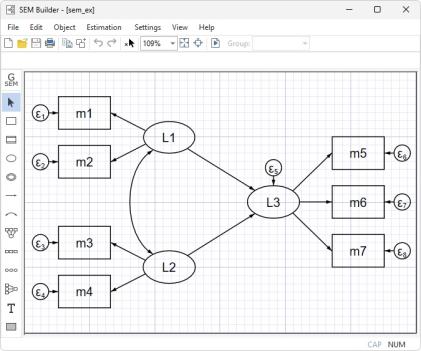
Introduction to Structural Equation Modelling using Stata (2-day)
Designed as an applied introduction to SEM using Stata, this course aims to provide participants with a sound understanding of when to use SEM and how to assess and report their models

Applied Choice Modelling using Apollo (2-day)
A hands-on introduction to applied choice modelling using the open-source Apollo software for the estimation of choice models.

NVivo Essentials (3-day)
The workshop aims to provide researchers with essential skills in using the NVivo software. The focus is on developing the essentials skills from NVivo through hands-on experience.

Introduction to LimeSurvey and CANVASS - (1.5 hours)
This short webinar demonstrates the set up and execution of an evaluation questionnaire. It shows how to use LimeSurvey for the first time, and gives some hints at the advanced functionality available for more experienced users.
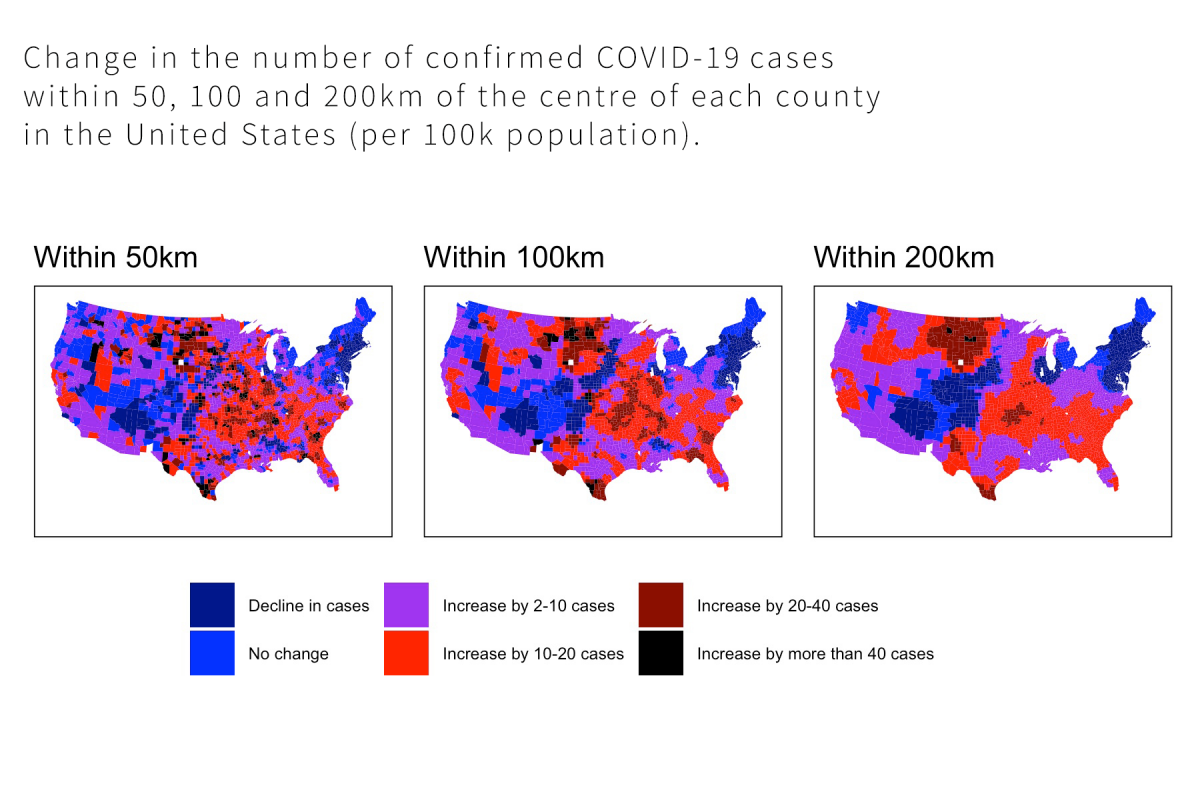
Spatial Analysis in R (2-day)
Designed for the applied users of R, this master-class will show you how to access spatial data from a number of sources, match this with geographic shape files, analyse spatial patterns, link these data to information from surveys, and create interactive maps to highlight important findings.

Applied Longitudinal Data Analysis
This course provides an overview of Longitudinal Data Analysis. As well as the statistical theory, an overview of the many applications and capabilities of LDA is given.
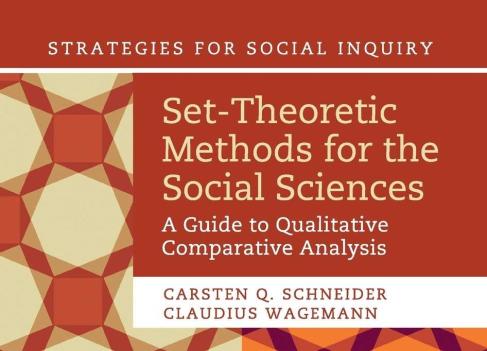
Applied Qualitative Comparative Analysis (QCA)
A course for participants who have experience in qualitative or quantitative research and who are interested in applying QCA in their current or future studies.

Fundamentals of Statistics
A 5-day introductory unit in statistical methods with the emphasis on statistical techniques applicable to the social sciences, although these introductory techniques are also relevant to the health sciences.

Advanced Statistical Analysis Using R
The focus of this course is on learning advanced statistical methods using R.
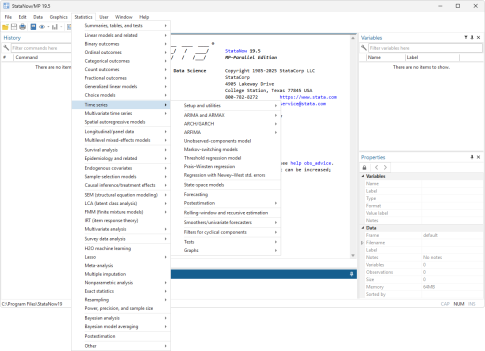
Introduction to Time-Series Analysis using Stata (2-day)
This course is an introduction to time-series concepts and univariate time-series analysis. This course takes a practical applied approach (rather than mathematical), in running basic time-series analysis using Stata.

Data Analysis in R
This course will help build participants’ ability to work with data in R and undertake rigorous statistical analysis, including spatial analysis and linear regression, creating publication-standard graphs of the results.
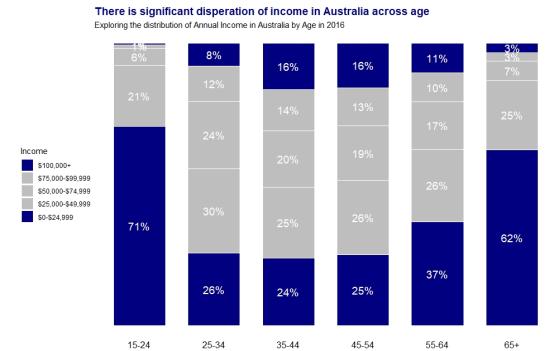
Storytelling with Data Visualisation (3-day)
This master-class has two objectives – to teach the design principles required to make plots that really have an impact on the reader, and to teach the practical skills required to create these plots within the R software package.
Structural Equation Modelling (SEM) Fundamentals (3-day)
This 3-day course is designed to cover the fundamental principles of Structural Equation Modeling (SEM) and introduce the AMOS and/or Mplus software packages to estimate structural equation models.
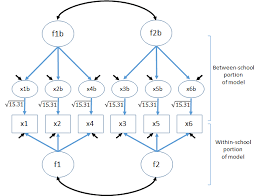
Multi-level Analysis using Mplus
An introduction to the concepts and techniques required to analyse data that is multi-level in nature. (That is, data that is derived from subjects who are nested within groups or data that involves repeated measures that are nested within subjects).

Introduction to Deep Learning for Social Sciences (3-day)
Whether you're looking to add AI to your research toolkit or just curious about what deep learning can do, this masterclass will give you the foundation you need to start experimenting with confidence.
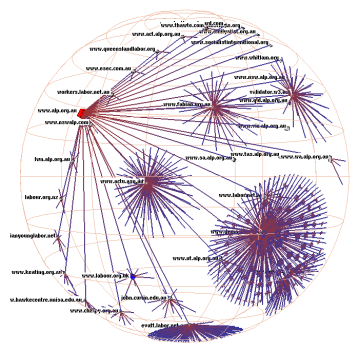
Social Network Analysis in R
A practical introduction to the network perspective and social network analysis (SNA), with a focus on applications in political analysis.
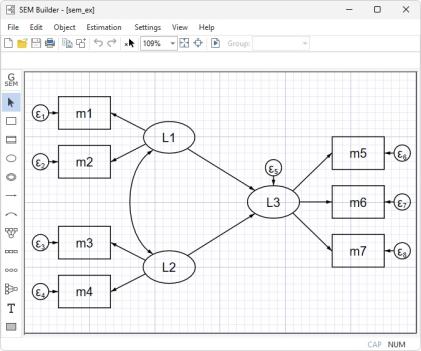
Structural Equation Modelling using Stata (2-day)
Designed as an applied introduction to SEM using Stata, this course aims to provide participants with a sound understanding of when to use SEM and how to assess and report their models.

Foundations of Programming in R for Political Analysis in the Age of AI
This course offers hands-on training in R programming for quantitative political analysis, paired with practical and responsible techniques for using AI assistants to write, debug, and verify data analysis code.