Instructor

Dr Joanna Dipnall is an applied statistician with particular interests in the advanced statistical methods and machine and deep learning techniques. She completed her Honours in Econometrics with Monash University and PhD with IMPACT SRC, School of Medicine, Deakin University. Joanna works extensively with registry and linked medical data and collaborates extensively with the Faculty of IT at Monash to supervise Masters and PhD students to integrate AI within health research. Joanna teaches within the Monash Biostatistics Unit and is the Unit Coordinator for the Monash Masters of Health Data Analytics course. Joanna has taught advanced statistical methods for many years at universities and for ACSPRI.
Multivariate statistics provide researchers with the ability to analyse complex data sets. It allows them the ability to plot large sets of data, reduce the number of variables, predict and identify groups of inter-related variables, and detect natural groups of observations.
The aim of the course is to provide the participants with an understanding of different multivariable analysis techniques, sufficient to determine the appropriate technique for a given problem, format data as required for analysis, run the analysis using the Stata statistical program, and interpret the results.
Stata is a comprehensive integrated package for data management, analysis and graphics. Sample datasets will be provided.
The course is suitable for researchers of varying disciplines.
This course will be run over 3 days in the following sessions:
- 9.30 am - 11.00 am: Instructional Zoom session
- 11.30am - 12.30 pm: Instructional Zoom session
- 1.30 pm - 3.00 pm: Instructional Zoom session
- 3.30 pm - 4.30 pm: Exercises
Day 1
Overview of Multivariate analysis: An introduction to multivariate analysis and the different issues.
Issues with data: There are many issues analysts face when deciding on the appropriateness of different multivariate analysis techniques. A brief introduction to these issues and discussion of data integration, missing data, and an introduction to Stata's multiple imputation techniques.
Multiple Regression: Multiple regression analysis is often used to model the relationship between a single dependent interval variable with several varying types of independent variables. This technique is often used in economics for prediction and forecasting (e.g. national economy), and in social research for evaluating what determines an effective program (e.g. the best predictors of success in high-school), or determining which personality variable best predicts a social trait.
Day 2
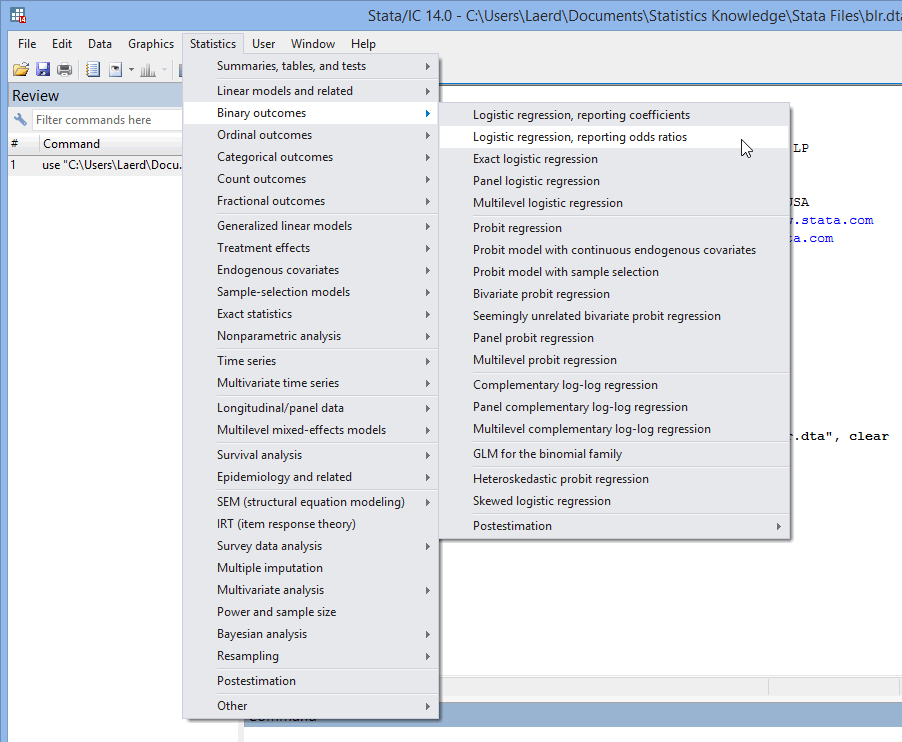
Binary Logistic Regression: Binary logistic regression is used when there is a binary dependent variable and several varying types of independent variables. Logit analysis is used to predict the probability of an event in the dependent variable. The analysis is used widely in health research where the dependent variable is the outcome of a disease or health condition (e.g. lung cancer), or in social research where the outcome is a certain event, (e.g. employment status).
Ordinal Logistic Regression: Ordinal logistic regression is used when there is an ordinal dependent variable and several varying types of independent variables. Logit analysis is used to predict the probability of an event in the dependent variable.
Survival analysis: Survival analysis data deals with the outcome being the waiting time until the occurrence of a well-defined event. Observations are censored, in the sense that for some units the event of interest has not occurred at the time the data are analysed and explanatory variables are used to control for the effect on the waiting time. The point of survival analysis is to follow subjects over time and observe at which point in time they experience the event of interest (e.g. cancer). Survival analysis is often referred to as time to event analysis, mainly used in biomedical sciences where the interest is in observing time to death. However, over the past few years this analysis has been extended to other areas of research such as the social sciences (e.g. forensic analysis, employment analysis, marriage) and even engineering sciences (e.g. failure time analysis). An introduction to competing risks survival analysis will also be covered in this course.
Day 3
Exploratory Factor analysis: Exploratory Factor analysis is used to obtain distinct new variables of factors. Factor analysis looks at the interrelationships among a large number of variables and explains them in terms of their underlying factors or dimensions. This technique is often used in social science to measure a trait that cannot be measured directly (e.g. self-esteem).
Cluster analysis: Cluster analysis is an exploratory technique that uses a number of different algorithms and methods to combine observations into previously unknown mutually exclusive natural groups or clusters based on specific similarities. For example, social researchers have used this technique to produce unique groups based on socio-economic profiles.
Correspondence analysis: Simple correspondence analysis provides graphical representations of two-way frequency tables to improve the researcher’s understanding of any similarities and associations between the variables. Thus, it is especially good for the analysis of large contingency tables. For example, it could be used to investigate various crimes across the different states.
Participants should have completed an intermediate statistics course covering at least some of the syllabus of Data Analysis using Stata. Experience with Stata will be assumed (e.g. use of Stata’s Do files).
For an overview of the Stata package, please visit http://survey-design.com.au or http://stata.com.
It served as a helpful exposure to a wide range of statistical techniques
Covered some new things that I hadn’t known about before
Theory & pracs good - lots of emphasis on pre & post testing of data before analysis !!! great.
Syntax, course notes, broad coverage, so very helpful.
Exposure to someone who really knows her stuff.
catered to diff students but seemed to suit all our levels. We all got what we needed out of it.
The instructor's bound, book length notes will serve as the course text.
The notes will be posted to your nominated 'shipping address' in advance.